


The new Excel gives you intuitive ways to explore your data, inspiring you to get to new insights. In one click, discover new ways to visualize your data, and see your information in new depths. Enjoy working with and analyzing your data – the new Excel guides you with charts and tables based on your data, and helps you get the job done faster. A new, clean view made as much for the tap, touch, and turn of your fingers as the click of your mouse or keyboard means you can move naturally through your information. With Excel, explore your data at new depths in less time.
Discover and reveal the insights hidden in your data
* Requires an Internet connection; must be signed in with a Microsoft account or a Microsoft Online Services ID.
What's new in Excel 2013
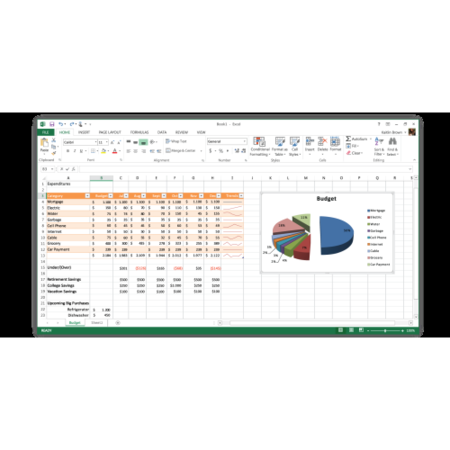
The first thing you’ll see when you open Excel is a brand new look. It’s cleaner, but it’s also designed to help you get professional-looking results quickly. You’ll find many new features that let you get away from walls of numbers and draw more persuasive pictures of your data, guiding you to better, more informed decisions.
Top features to explore
Get started quickly. Templates do most of the set-up and design work for you, so you can focus on your data. When you open Excel 2013, you’ll see templates for budgets, calendars, forms, and reports, and more.
Instant data analysis. The new Quick Analysis tool lets you convert your data into a chart or table in two steps or less. Preview your data with conditional formatting, sparklines, or charts, and make your choice stick in just one click.
Fill out an entire column of data in a flash. Flash Fill is like a data assistant that finishes your work for you. As soon as it detects what you want to do, Flash Fill enters the rest of your data in one fell swoop, following the pattern it recognizes in your data.
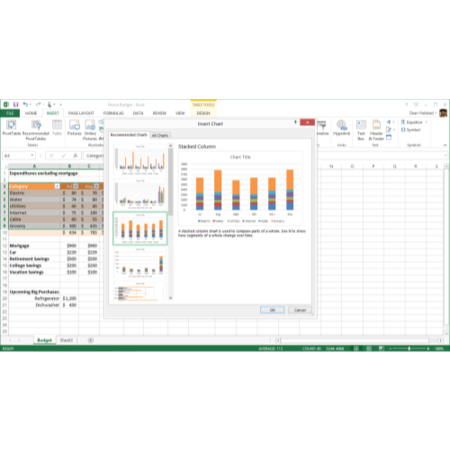
Create the right chart for your data. With Chart recommendations, Excel recommends the most suitable charts for your data. Get a quick peek to see how your data looks in the different charts, and then simply pick the one that shows the insights you want to present.
Filter table data by using slicers. First introduced in Excel 2010 as an interactive way to filter PivotTable data, slicers can now also filter data in Excel tables, query tables, and other data tables. Simpler to set up and use, slicers show the current filter so you’ll know exactly what data you’re looking at.
One workbook, one window. In Excel 2013 each workbook has in its own window, making it easier to work on two workbooks at once. It also makes life easier when you’re working on two monitors.
